 Gambling
related articles
Modelling
Results of AFL Games
Part
2
By
Scott McIntosh
Introduction
In a previous article I described a model that uses
the normal distribution to describe the outcome of
AFL games.
Only 2 inputs are required: a mean (e.g. bookies
line or handicapping prediction) and standard deviation
(e.g. 38 obtained from historical data).
In this article I will describe how to use the model
to determine different probabilities for a variety
of outcomes. Please read Part
1 to understand the accuracy and limitations
of this model.
Method
For the following discussion, note that a winning
margin can be positive or negative depending on which
team wins. The mean / predicted line used for the
following calculations is quoted as positive in terms
of the favoured team's average winning margin. Therefore
a positive winning margin represents the favoured
team winning and a negative winning margin represents
the underdog team winning.
The normal distibution is a continuous function (e.g.
1.2, -24.123, 39.5) whereas the final result of an
AFL game is discrete, limited to integers (e.g. 1,
-24, 39). To calculate the probability of a certain
winning margin X occuring we use the normal
distribution function to calculate the probability
for the result to be between X - 0.5 and
X + 0.5. For example for a winning margin
of 39 we calculate the probability of the result occuring
between 38.5 and 39.5. For the special case of the
draw we calculate the probability between -0.5 and
+0.5.
To calculate the chances of a team winning we could
add the probabilities for a team winning by 1,2,3
... up to infinity. In practice I use 999 or some
such large number as the maximum possible winning
margin. Instead of adding all the probabilities for
each result together we can use what is called the
cumulative normal distribution function (CNDF) to
calculate the desired probabilities. Using the function
notation CNDF(result, mean, standard deviation) we
can determine the probability of a result falling
between a minimum and maximum winning margin as follows.
| Probability (minimum, maximum) |
= CNDF (maximum, mean, standard
deviation) - CNDF (minimum, mean, standard deviation) |
| |
= CNDF (maximum, predicted line,
38) - CNDF (minimum, predicted line, 38) |
Examples
1. Line 15.5 Favourite team to win
Probability (0.5, 999) = CNDF(999, 15.5, 38) - CNDF
(0.5, 15.5, 38)
2. Line 15.5 Underdog team to win
Probability(-999, -0.5) = CNDF(-0.5, 15.5, 38) - CNDF(-999,
15.5, 38)
3. Line 15.5 Draw
Probability(-0.5, 0.5) = CNDF(0.5, 15.5, 38) - CNDF(-0.5,
15.5, 38)
4. Line 15.5 Favourite to win by under 39.5
points
Probability(0.5, 39.5) = CNDF(39.5, 15.5, 38) - CNDF(0.5,
15.5, 38)
5. Line 15.5 Underdog to win by over 39.5
points
Probability(-999, -39.5) = CNDF(-39.5, 15.5, 38) -
CNDF(-999, 15.5, 38)
To calculate the precise values for these equations
you can use the online calculator provided or an Excel
spreadsheet as described below.
Excel
Excel provides the very useful NORMDIST function
which can be used to easily calculate probabilities
as previously described.
The following cells are what a user would input.
Cell A1: Predicted Line
Cell A2: Standard Deviation
Cell A3: Minimum winning margin
Cell A4: Maximum winning margin
The following cells contain formulas to calculate
the results. Cell A5 represents the probaility and
Cell 6 represents the 'fair' odds given this probability.
Cell A5: = NORMDIST(A4, A1, A2, TRUE) - NORMDIST(A3,
A1, A2, TRUE)
Cell A6: = 1 / A5
Examples
1) Line 15.5 Favourite team to win
A1 = 15.5, A2 = 38, A3 = 0.5, A4 = 999
A5 = 0.65348, A6 = 1.53026
2) Line 15.5 Underdog team to win
A1 = 15.5, A2 = 38, A3 = -999, A4 = -0.5
A5 = 0.33685, A6 = 2.96860
3) Line 15.5 Draw
A1 = 15.5, A2 = 38, A3 = -0.5, A4 = 0.5
A5 = 0.00966, A6 = 103.51707
4) Line 15.5 Favourite to win by under 39.5 points
A1 = 15.5, A2 = 38, A3 = 0.5, A4 = 39.5
A5 = 0.38965, A6 = 2.56640
5) Line 15.5 Underdog to win by over 39.5 points
A1 = 15.5, A2 = 38, A3 = -999, A4 = -39.5
A5 = 0.07389, A6 = 13.53236
Accuracy of Predictions
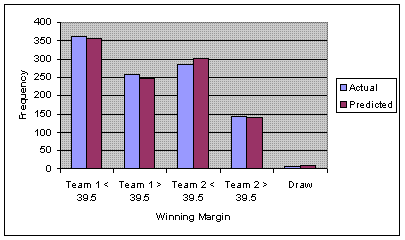
Graph 2 indicates the frequency of actual versus
predicted results using the bookmakers line as the
mean for the normal distribution model. It examines
the results for the over/under 39.5 point margin bet
frequently offered by bookmakers. Although there does
seem a minor bias toward home teams winning more frequently
than predicted, the predictions correlate closely
to reality.
Graph 2 - Under/Over 39.5 Point Results
(1056 Home and Away Games : 2000 - 2005)*

*Note: Team 1 is the home team as listed in
the fixture.
Conclusion
Applying the normal distribution model of AFL game
results it is reasonably straightforward to calculate
a probability for any winning margin to occur. These
probabilities seem to correspond reasonably well to
reality. In my next article I will describe how the
normal distibution model for AFL game results can
be applied to determine probabilities during the course
of a game (e.g. for "in the run betting")
Scott
McIntosh runs the website Online
Poker Room Reviews
Proceed
to Part 3 of this series
Home|FAQs|Disclaimer|Contact
Us
©2000 to present.
OZmium Pty Ltd. All rights reserved